


Our most-asked question is how to develop meaningful performance measures. But no matter how meaningful they are, how well-aligned to strategy they are, how engaged with them people are, how beautifully presented on a dashboard they are, KPIs will do more damage than good if they aren’t telling you the truth.
When a KPI doesn’t tell the truth, you can’t take the right action. You might find it’s hard to get everyone to agree on when and how to respond to a KPI. You might end up taking action when you don’t need to, which wastes the money, time and effort you’re already spreading too thin. And there are also times when you don’t take action, without realising you actually need to prevent an emerging problem from getting worse.
Most KPIs aren’t able to tell you the truth…
The big problem is when we don’t even realise our KPIs are not telling the truth. And, it might be hard to believe, but with our typical and traditional ways of analysing data and interpreting KPIs, most KPIs are not able to tell us the truth! This means that:
- We can be unknowingly misled by popular KPI presentation methods, such as trend lines and month-to-month variances
- We can end up making performance worse (not better) by continually comparing each KPI value to targets
- We miss out on the opportunity to directly and quantitatively measure the impact of initiatives and improvement projects to find out if they really are worth the time and money

We can put all this wasted money, time and effort behind us with a simple change in how we visually display our KPIs.
There is one chart we use in PuMP that will get the truth out of your KPIs, and give you back the power to improve performance. We call it the Smart Chart. It’s really a XmR chart, part of a field of statistical theory that has been widely used and thoroughly proven over more than a century. These charts have actually been used by world-class companies for decades, but has flown under the performance management radar for too long.
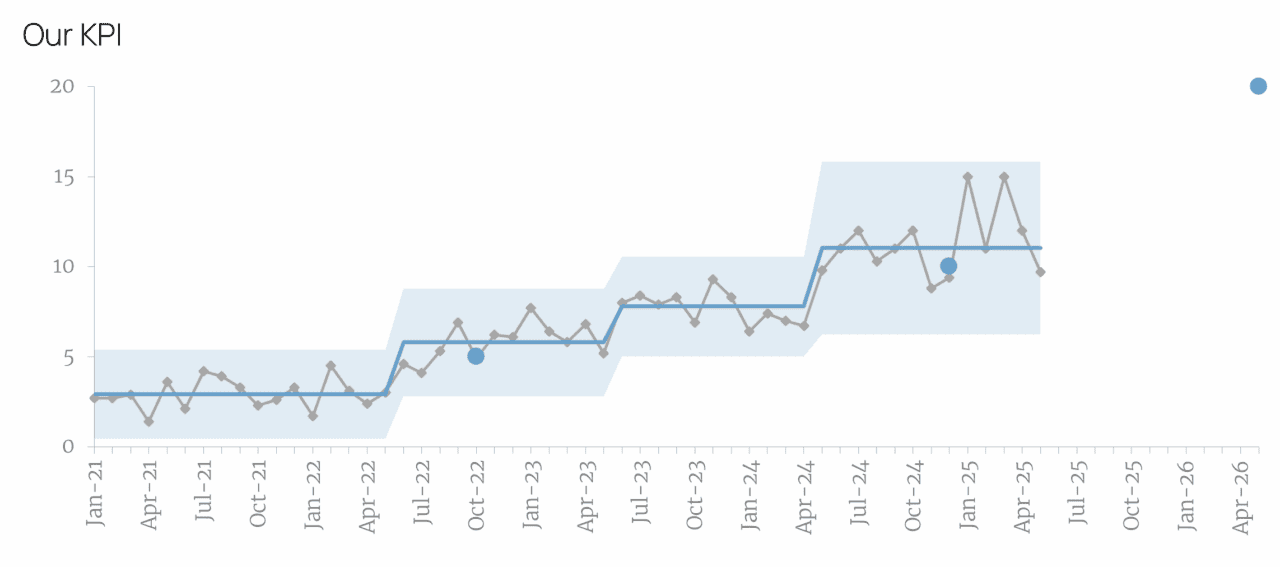
And it’s worth mentioning that, rather than the traditional focus that XmR training has on manufacturing, this Using Smart Charts training is much more targeted at the KPIs and performance measures we use to execute strategy, manage operations, and continually improve our work processes.
Using Smart Charts is for everyone who uses KPIs…
The Using Smart Charts program walks you through the practical how-to steps of creating these XmR Smart Charts, in a way that you can easily understand and follow without having any prior knowledge or any mathematical skill at all.
In our full PuMP Blueprint training, where we teach the basics of the Smart Chart, even participants who typically aren’t comfortable with numbers just love it. But you don’t need to have any PuMP Blueprint training to get all the value from Using Smart Charts.
Using Smart Charts gives you all you need to know.
We go deeper into Smart Charts in this program, compared to our basic introduction in the PuMP Blueprint. There are heaps of examples, live demonstrations, hands-on activities, and opportunity for discussion and Q&A. You will learn these XmR charts deliberately and accurately, but also in a very easy and fun way.
Start with Module 1 for free:
MODULE 1: How your KPIs are telling you lies [Free introduction]
- The risk of traditional and commonly used KPI analysis methods
- The question that Smart Charts answer better than traditional analyses
To see the remaining topics covered in the Using Smart Charts program, click to expand the section below:
MODULE 2: What is a Smart Chart?
- The history of XmR charts
- The anatomy of the XmR chart
- Misconceptions and traps to avoid
MODULE 3: Interpreting Smart Charts the right way.
- How to interpret XmR chart signals
- The rules to define the signals
- When and how to recalculate your KPI “baseline”
MODULE 4: The exact steps to create Smart Charts.
- Step-by-step instructions to create Smart Charts (and XmR charts)
- A demonstration of creating the Smart Chart (and XmR chart in full)
- The Smart Chart Excel template
MODULE 5: Displaying Smart Charts in KPI reports.
- The 3 questions we ask of our measures
- Setting targets for your KPIs
- Rules for traffic lights to prioritise attention and action
- Using Smart Charts on your performance dashboards
MODULE 6: Using Smart Charts to improve performance.
- Helping others understand the value of Smart Charts
- The process for improving performance with Smart Charts
MODULE 7: Advanced use of XmR Charts.
- Considerations when using different types of KPIs with Smart Charts
- Smart Chart examples in different fields of performance
- Modifications required for Smart Charts for seasonal, trending and rare event KPIs
- More signals to look for (another 7 over the basic 3 already covered)
- The value of mR charts (the second part of the XmR chart)
- When NOT to use Smart Charts
Well run training giving a great foundation and introduction to more advanced information on Smart Charts (aka Process Behavior Charts, XmR Charts). I really enjoyed training, which built on my existing knowledge and gave me a couple of new tips and tricks to use moving forward. Thanks!
Rob Leeming, Water Corporation, Perth WA
What’s included:
- Step-by-step instructions and demonstration of how to create the Smart Chart for virtually all your KPIs, without special software or statistical skills.
- How to use the Excel template for Smart Charts, and creating your first Smart Charts for your own KPIs using this template
- A checklist of the basic and more advanced interpretation rules that make the Smart Chart the easiest chart to interpret quickly, accurately, consistently and with confidence every time.
- The broad range of KPI types that suit Smart Charts and how to know when it’s not appropriate to use Smart Charts.
- How target setting becomes a breeze and a nifty new way to put targets on your KPI graphs that uses fewer pixels but conveys more information.
- How to put Smart Charts into your performance dashboards to achieve simultaneously what the popular space-saving sparklines and bullet graphs currently achieve together.
- The process for closing performance gaps by combining Smart Charts with an experimental approach to performance improvement.

It’s like a guided implementation…
You’re also supported by an easy to follow and detailed how-to workbook, plus an Excel Smart Charts template ready to quickly create beautiful XmR charts for your KPIs.
Using Smart Charts is a practical, get-it-done kind of course: think about it as a guided implementation. It will get you using Smart Charts straight away, in the right way, on real KPIs, so you can improve performance with more speed and impact than ever before. When you find your first insight from one KPI in these charts, you’ll get your investment back many times over!
We were provided with substantial insights into the practical applications of smart charts, particularly regarding how to secure the endorsement of senior management and to foster broad adoption of the process across the organization.
Participant, October 2025
Your Using Smart Charts expert team…
Using Smart Charts Creator

Stacey Barr is a specialist in evidence-based leadership and organisational performance measurement. Stacey is the creator of PuMP and its suite of programs, host of PuMP Academy, and author of two books, Practical Performance Measurement and Prove It! Starting her career as a statistician inspired Stacey to build statistical rigour into the PuMP methodology, and also this Using Smart Charts course. Her Smart Chart methodology was reviewed by modern-day XmR chart expert, Donald Wheeler, to ensure its validity.
Using Smart Charts Trainer & Coach

Ayça Tümer Arıkan is a licensed PuMP Affiliate, and has worked as a measurement consultant and mentor since 2017 to help companies in their journey to become high performing organisations with the use of measurement in a meaningful way. Ayça is a statistician with an MBA degree, a very skilled coach and team facilitator, and her deep knowledge of XmR charts expanded this course to include many more examples and situations to support the implementation of Smart Charts. Clearly, Ayça has the perfect expertise as the official trainer and coach for this program.
Ayça demonstrated exceptional clarity in presenting challenging concepts, turning complexity into understandable insights.
Participant, October 2025
Thanks for a great session – Ayça was super knowledgeable and helpful.
Participant, October 2025
I really enjoyed this workshop. It was very hands-on, and Ayça did a great job of explaining it in an easy-to-understand way. It helped me build on the exposure I had to XmR charts in the PuMP Blueprint course I took. I feel a lot more confident about being able to work with them, and I’ve come away from the course excited about implementing them at my organization. I appreciate that Ayça was willing to do a training session for people in a completely different time zone. Also, the cost is quite reasonable.
Participant, September 2025
Overall the training was interesting, and Ayça had answers for all of our questions. The training did a good job explaining the statistics behind the process but also helping people work through the human aspect of chart interpretation. This is the type of training that is difficult to get through a blog or textbook, and it was helpful to have a conversation about different scenarios and why you may or may not want to follow rules at different junctures.
Participant, September 2025
Join our upcoming live program…
Using Smart Charts is a live, 3-part training program comprising 7 modules on how to use XmR charts for monitoring, interpreting and improving KPIs and performance measures.
Our Using Smart Charts program is expertly facilitated by our official Using Smart Charts trainer and coach, Ayça Tümer Arıkan.
PLASE NOTE: This program is live only, recordings will only be available to participants for 14 days as a backup.
For Australia & Asia Pacific
Dates: 24th, 25th, 26th June 2026
Time: 11am – 3pm AEST | 1pm – 5pm NZST
Full Price: $950 AUD (plus GST for Aussies)
Early Bird Price: $750 AUD available until 27 May 2026
REGISTRATION CLOSED
For the Americas
Dates: 15th, 16th, 17th July 2026
Time: 8am-12pm PDT | 10am-2pm CDT | 11am-3pm EDT
Full Price: $950 AUD
Early Bird Price: $750 AUD available until 19 June 2026
REGISTRATION CLOSED
For Europe, Africa & Middle East
Dates: 16th, 17th, 18th September 2026
Time: 8am-12pm WAT | 10am-2pm EAT | 11am-3pm GST
Full Price: $950 AUD
Early Bird Price: $750 AUD available until 21 August 2026
REGISTRATION CLOSED
If you have any questions, or would like to be notified when the 2027 training dates are available, please email us at [email protected].