
Leaders know how essential it is to demonstrate if the time, money and effort being spent is having the intended impact on the organisation’s success. Using these four types of progress measures, in balance, makes it much easier.

Getting useful data and measures that accurately monitor the progress of activity and results, both in the moment and over time, is a challenge for most of us. Consequently, we put up with the overwhelm of an excessive number of less-than-insightful activity metrics, and hope for the best.
And there is hope, but it starts by first getting some clarity about what information we really need to feel in control of making progress. This clarity comes from the discovery of four types of progress measures that, when used together in the right balance, make sure the right activities are leading to the desired impacts.
What do we mean by “progress”?
Progress happens to both our results and our activity. It’s useful to know how well we’re reaching our goals and it’s useful to know how well we’re doing the activity to reach those goals. So, we want to make progress in our results, which is the impact we’re trying to make. And, we want to make progress in our activity, which is all those tasks and projects that are the input to make the impact.
Progress also happens over time, and in the moment. It’s useful to know what level we’re capable of holding over time, and it’s useful to know how we’re doing right now. So, we want to make progress in our performance capability over time, ideally in a way that creates more leverage. And, we want to make progress right now, through the labour we each undertake in our day-to-day work.
This thinking leads us to four dimensions of progress: inputs, impact, labour and leverage. There is a natural relationship among these four dimensions, and this gives us a framework of four types of progress measures.
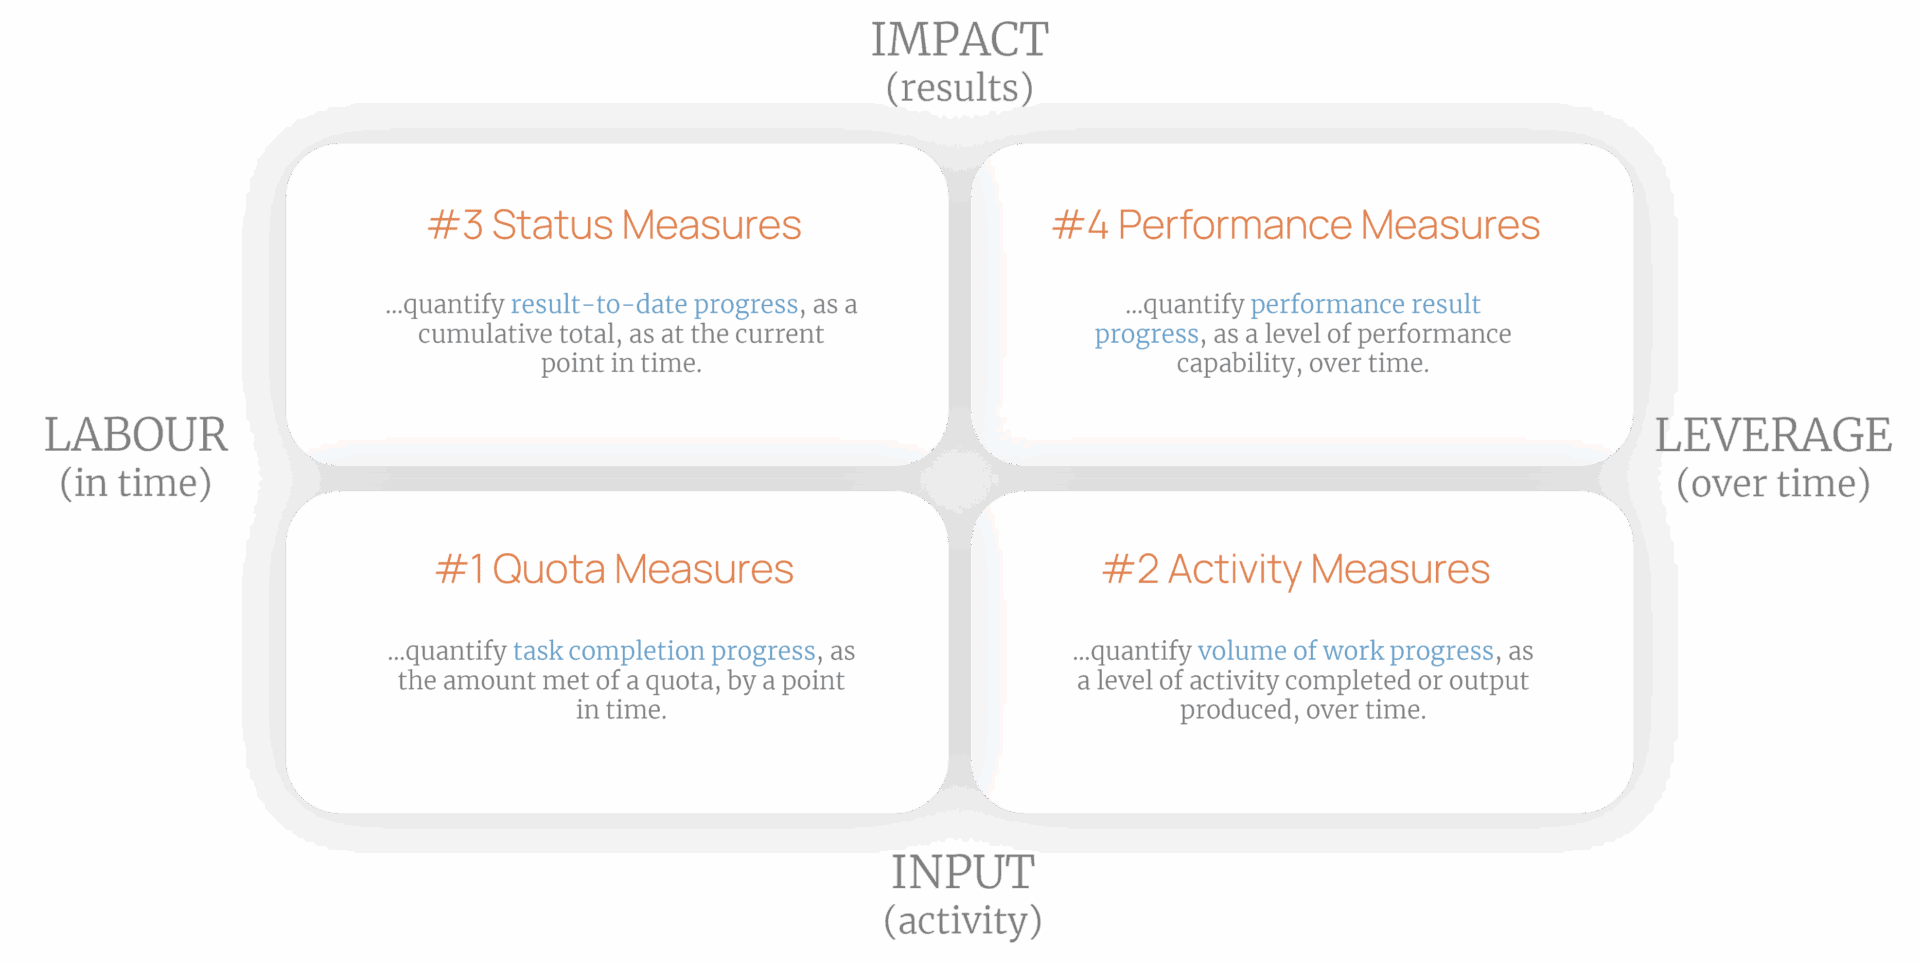
#1 Quota Measures
Quota Measures quantify task completion progress, as the amount met of a quota, by a point in time. They count how many times a task was completed in a set period of time, like a day or a week. The quota is a kind of target, but rather than a performance improvement target, it’s a target for what we expect we can achieve already through our daily or weekly work. Quota Measures are most often assigned to individual people, but they can also be used by teams that work together to perform the same task.
Examples of Quota Measures include:
- For a vehicle safety inspector, they may have a quota to perform 5 Completed Compliance Inspections per day.
- In boosting learning outcomes, teachers might be given a quota of New Curriculum Resources Trialled, aiming for 10 per class that they teach.
- A doctor in a general practice might have a quota of Number of Telehealth Consultations, aiming for 20 per week.
- Sales reps almost always have daily or weekly or monthly quotas for things like the Number of Sales Calls Made, Number of Product Sales, and Total Revenue Sold.
- Writers often set themselves daily quotas on the Number of Words Written toward their blog posts, white papers, books or other manuscripts, such as 1000 or 1500 or 5000 words per day.
Because Quota Measures count the number of task outputs against an expected target number, or quota, simple tallies are an example of how to track them. But if they will be reported on a performance dashboard, then a simple bar chart of actual task completion versus the quota is a better visual.
Done right, Quota Measures can help us improve progress in getting things done day by day through disciplined action. And one of the best ways to improve the achievement of Quota Measures is to design day-to-day tasks so they are as efficient as possible, such as:
- Clearly documenting the instructions for how tasks are best executed.
- Using checklists as a quick reference to keep on track with taking the right steps.
- Finding tools that help automate or speed up some of steps, like scanners or even AI.
- Scheduling opportunities to learn from each other and find best practices in executing the tasks.
For example, to help vehicle safety inspectors to meet their quota of 5 Completed Compliance Inspections each, per day, it might help to provide each inspector with a full set of digital diagnostic tools, like inspection apps, that integrate with a wider range of vehicle on-board diagnostic systems.
How to bring Quota Measures into balance…
There are some benefits and risks of using Quota Measures as part of monitoring progress, which need to be taken into consideration when we choose to use this type of progress measure:
| Benefits of Quota Measures | Risks of Quota Measures |
|---|---|
| They provide very tangible focus for people to direct their daily efforts. They give very quick feedback that people can potentially use to find improvements in the design of their tasks. They build the muscle of discipline in getting things done. | If the results or impacts are not clear first, they can drive people to hit short-term targets that don’t matter. If they are used to make comparisons between people, they can inadvertently encourage gaming of the measures and unhealthy competitive behaviour. They can put too much focus on hitting numbers and take attention away from the quality of output. |
We can certainly help everyone get more clarity on our day-to-day progress with the right Quota Measures. But we need to be careful of relying too heavily on them without the context of through-time and result-oriented progress measures. Quota Measures serve us best when they focus on monitoring short-term progress in the tasks that will drive longer-term results.
For these reasons, it’s best to set Quota Measures only after the desired impact or results are clearly defined and understood by everyone. We want Quota Measures to help monitor and improve the day-to-day habits that most contribute to achieving the strategic direction for the organisation.
How well are Quota Measures used in your organisation?
If you’d like to take a moment to think about how Quota Measures are currently used in your organisation, here are a few questions to ponder:
- Are your Quota Measures driving the behaviours that help organisational performance improve, or are there instances where they drive unhealthy competition or too much metrics fixation?
- Is there too much reliance on Quota Measures, where other types of progress measures do a better job? [Read on to learn more about the other types of progress measures.]
- How exactly are Quota Measures chosen and decided upon? Are they set in the context of organisational strategic direction, or are they based too much on what’s easy to track?
#2 Activity Measures
Activity Measures quantify the volume of work progress, as a level of activity completed or output produced, over time. In other words, they count the amount of work completed. They differ to Quota Measures, the other type of progress measure that tracks activity rather than results, in that they focus on trends and shifts over time. Activity Measures, like Quota Measures, can be used by individuals, but they are more often used by teams or business units to track collective activity and outputs.
Examples of Activity Measures include:
- A social security department might measure the Number of Welfare Applications Processed per week.
- A college might measure the Number of Tutoring Sessions per month.
- A medical practice might measure the Number of Diagnostic Tests Performed per month.
- Many Learning & Development teams measure activities like Training Attendance Rate, Course Completion Rate, and Number of Employees Trained.
- Software engineers might measure their activity progress with Lines of Code Written, Code Deployed, and Work in Progress.
Because Activity Measures count the number of task or process outputs produced over time, we need to visualise these measures in a time series, to see the trends and shifts. That’s why line charts are a good example of how to monitor them. In PuMP, however, we use XmR charts, or Smart Charts, because they do even more than a line chart can do. They are the most accurate visualisation for highlighting signals of change and quantifying performance gaps, like the difference between the current baseline and the future target. [Learn more about XmR charts here.]
Done right, Activity Measures improve progress in output productivity over time. Producing more of the right outputs is helped by standardising, streamlining and even automating parts of our work processes, such as:
- Flowcharting the best way to complete an activity, so everyone knows how to do it consistently.
- Removing unnecessary or outdated legacy steps that don’t contribute to producing the right outputs, such as unnecessary approvals or duplicated checks.
- Using digital tools or AI to perform steps that don’t require mastery or technical experience, such as finding research or simplifying writing.
For example, to increase the progress of Number of Welfare Applications Processed per week, the welfare team might collaborate to standardise on their agreed highest priority application assessment criteria.
How to bring Activity Measures into balance…
Getting the best from Activity Measures as part of monitoring progress does depend on how they are chosen, and what they are used for, so we need to balance the benefits with their risks:
| Benefits of Activity Measures | Risks of Activity Measures |
|---|---|
| They are easy for people to relate to because they measure outputs they are close to as part of their work. They are the basis for measuring and improving productivity, the rate at which outputs can be produced relative to the resources used. They can help with matching resources and schedules to changing levels of workload. | They have no meaning without the context of results, and they are most definitely are not evidence of result or impact. They can drive too much focus on productivity at the expense of quality. On their own, they can be misleading – and even misinterpreted – without additional companion measures that track the variation in complexity or difficulty of the work required to produce the same outputs. |
Activity Measures will be most valuable when they are chosen to support result-oriented measures and when they are used in companion with other measures that add relevant context about complexity. We want Activity Measures to help monitor and improve productivity so we can make the most of limited resources, and to create capacity for the work needed to achieve the results implied by the strategic direction for the organisation.
How well are Activity Measures used in your organisation?
If you’d like to take a moment to think about how Activity Measures are currently used in your organisation, here are a few questions to ponder:
- Given that Activity Measures tend to the most over-used type of progress measure, do you see too much reliance on these measures in your organisation?
- Are there situations where result-oriented goals are being monitored with Activity Measures that don’t give any evidence of how well those results are being achieved?
- How exactly are Activity Measures chosen and decided upon? Are they set in the context of organisational strategic direction, or are they based on what data is easily available, or what has traditionally been measured?
#3 Status Measures
Status Measures quantify a result-to-date progress, as a cumulative total, as at the current point in time. Often they also have a target total to reach, say, each year. Each week or month, we check as see how much we’ve achieved so far for the year (the typical time frame for Status Measures), and how much we have left to achieve in the time remaining.
Examples of Status Measures include:
- Most government agencies will measure % Annual Budget Spent, obviously to get a current snapshot of how much as been spent compared to a total that was allocated.
- An education department might monitor the Year-to-Date School Attendance Rate, and might be aiming for an attendance rate of at least 90% for the year.
- A hospital may regularly check on the Total Number of Telehealth Subscribers, against a target to reach 1000 by the end of the year.
- An app developer may want to monitor % Users Migrated to New App, aiming to get 100% of existing users migrated before the old app’s planned decommission date.
- For many businesses, they would be interested to monitor Total Revenue Earned so far within the current financial year.
Because Status Measures give us a snapshot of the current level of progress so far within a set time frame, we can track them in a cumulative bar chart, showing the progress growing at regular intervals within that time frame (like every month within a calendar year). It’s best to avoid using a line chart, because line charts suggest trends, and we cannot see trends in Status Measures.
Done right, Status Measures give us a quick overview of our current level of progress relative to a desired end state or set time frame. Reaching that finish line on time really depends on the other progress measures, which more easily point to possible improvement actions than do Status Measures, such as:
- For a government agency to understand progress of % Annual Budget Spent, they might look to some Activity Measures that show the rate at which work is being completed.
- An education department may find clues to improve the Year-to-Date School Attendance Rate in Performance Measures (discussed next in this article) like Student Engagement Rate, Parent Participation Rate, and Teacher Turnover Rate.
- A hospital may work to increase their Total Number of Telehealth Subscribers by checking the degree to which doctors are achieving their quotas of 20 per week for Number of Telehealth Consultations, and looking at a Performance Measure of Patient Satisfaction With Telehealth Consultations.
How to bring Status Measures into balance…
We can’t learn from or make decisions from a Status Measure on its own, but they do form a useful part of our progress measure suite when we properly balance their benefits and risks:
| Benefits of Status Measures | Risks of Status Measures |
|---|---|
| They are very easy for everyone to relate to, as they are very common in most organisations, particularly with financial measures. They let us know how far we are away from reaching our target, or the finish line, for a specific result, and if we had set a projected path or expected values over time, we can see if we’re on track, ahead or behind where we planned to be right now. It’s hard for people to misinterpret them or draw the wrong conclusions from them. | They cannot show us trends over time, and therefore no feedback about whether our progress is speeding up or slowing down. They can make us react with a short-term focus, to try and kick up the result for next time, rather than digging deeper to understand what’s really happening and what kind of course-correction is most appropriate. They don’t show us variation over time, and it’s in the variation in measure values over time that we find the patterns and important signals of when and what types of changes are happening. |
We want Status Measures to give us a big picture snapshot of where progress of our results is currently sitting, and that can show us how far we have left to go to fully achieve our strategic direction. But Status Measures will be most valuable when they are used alongside other progress measures, particularly Performance Measures, which provide the information that Status Measures are missing.
How well are Status Measures used in your organisation?
If you’d like to take a moment to think about how Status Measures are currently used in your organisation, here are a few questions to ponder:
- How exactly are Status Measures chosen and decided upon? Is their ease and simplicity a factor in this, that might mean they are used even when they’re probably not the best choice of progress measure type?
- What is your decision process in responding to Status Measures? Do they trigger a superficial push to do better next month, or a deeper dive into the causes that need to be removed to allow faster progress?
- Are there any result-oriented goals monitored with Status Measures that might benefit from Performance Measures too, to get to insights faster?
#4 Performance Measures
Performance Measures quantify performance result progress, as a level of performance capability, over time. What they generally measure is the current capability of a business process or system to routinely achieve a particular level of performance result. Capability means that the current performance result is a consequence of the process design as it is, without having to tamper with or constantly push to achieve that performance result.
Examples of Performance Measures include:
- A transport department might measure Serious Road Crash Rate by month. The rate means crashes per 1000kms travelled, and it’s a measure of the safety capability of the road system.
- State primary schools might measure % Students Meeting Literacy Standards by quarter, and it measures one aspect of the curriculum and teaching capability of the school system.
- A hospital might measure % Patients With Unplanned Readmissions by week, and it measures the capability of the hospital system to fix patient injury or illness with the first treatment plan.
- A city council would likely measure Budget Variation, the actual spend as a percentage of planned spend, and try to reduce it over time to improve their capability in sticking to budget and not overspending or underspending.
- Many human resource departments are interested in measuring Overtime Expenditure on a monthly cadence, to monitor the capability of the workforce to get through the volume of work required.
Because Performance Measures quantify results over time, and we want to focus on signals of change and how well we’re closing performance gaps, we find the absolute best way of tracking them is using XmR charts, or Smart Charts.
Done right, Performance Measures are about improving our capability to consistently achieve important performance results over time. We improve this capability by improving or redesigning the business processes that have the biggest impact on those important performance results:
- Identifying which business process has the most significant impact on the result the Performance Measure monitors.
- Forming a cross-functional team to flowchart the business process, if it’s not already documented in the organisation’s process model.
- Working through the process flowchart, the cross-functional team systematically looks for root causes in the design of the process, that are causing the performance gap in the Performance Measure.
- Designing an experimental improvement initiative to address one or more of the causes, and see if it closes the performance gap in the Performance Measure.
For example, to decrease the % Patients With Unplanned Readmissions, one process that has a big impact on this might be patient education. The head nurses in each specialisation might review their patient education processes that help prepare patients for discharge. They might find that some of the information is too overwhelming for patients to fully absorb and then design an experiment to both simplify the layout of the information so it’s easier to follow, and also provide a follow-up for patients to check how well they are following the instructions.
How to bring Performance Measures into balance…
Performance Measures are an essential part of monitoring progress, and likely the most powerful of all the progress measure types. They are the most under-used and under-valued of all the progress measures, and most organisations don’t use them enough. But they still require us to balance their superior benefits with a few risks to get them right:
| Benefits of Performance Measures | Risks of Performance Measures |
|---|---|
| They focus on results, and are generally designed to support strategy execution and achievement, so they have a big return of the effort of creating and using them. They are excellent at showing changes over time, and if presented the right way, they can allow for fast course-correction to keep resources focused on closing performance gaps. They focus on organisational capability, which means they can point to root causes that need only be fixed once to almost permanently elevate performance. Therefore they can have more leverage in creating organisational success than any other type of progress measure. | They are definitely harder to identify than the other types of measures, particularly when the results they should monitor are quite intangible or vaguely articulated. New Performance Measures can be quite different to what the organisation has traditionally measured, and so data needed to calculate them may not be readily available. They generally are not 100% within the control of teams, and they can struggle with the tension between exercising what influence they do have, and the pressure to hit targets. |
Performance Measures will be most valuable when they designed as direct evidence of the performance results implied by the current strategic direction and all the business unit goals that align to that direction. We want Performance Measures to help us find the leverage to change the organisation’s processes and systems in a way that achieves the strategic direction for the organisation.
How well are Performance Measures used in your organisation?
If you’d like to take a moment to think about how Performance Measures are currently used in your organisation, here are a few questions to ponder:
- How are Performance Measures chosen in your organisation? Are they the result of brainstorming or AI suggestions, or are they deliberately designed to suit your organisation’s unique strategic and operational goals?
- Do you, like most people, put the design of Performance Measures on the backburner, due to the challenge of finding meaningful ways to measure your intangible goals?
- How integrated are Performance Measures with your strategy execution? Do they help identify, prioritise and evaluate the improvement and change initiatives that will ideally achieve your strategic direction?
Finding a balance in measuring & monitoring progress
There is a role for all four types of progress measures in executing our strategy and managing organisational performance:
- Quota Measures quantify task completion progress relative to a quota we want to reach at regular time intervals, and this makes them great for putting attention on the day-to-day habits that will get the right things done that are needed to reach our strategic goals.
- Activity Measures quantify volume of work progress to show the level of activity completed or outputs we produce overtime, which makes them great for putting attention on the productivity required to get the business-as-usual work done and ideally create some capacity for strategic improvement work too.
- Status Measures quantify result-to-date progress in cumulative totals that give us a snapshot of how far we’ve come and how much further we have to go, which is useful to help prioritise where more attention is needed on the other three types of progress measures.
- Performance Measures quantify performance result progress by helping us see the level of performance capability over time, and they are particularly good at helping us close the performance gaps of strategically important results.
Performance Measures are the most powerful of all the progress measures in creating a performance culture that accelerates the achievement of a strategic direction. That’s because:
- They give everyone a stronger focus on results and impact, working against the bias that we humans have for focusing too much on activity.
- They make it easier for everyone to align their own activity with what’s strategically important, so they make sure the right Activity Measures are chosen to support the achievement of strategy.
- They set the context for people to design their own daily disciplines to support achievement of strategy, so if Quota Measures are used, they are driving the right daily focus.
- They find and build performance-improving leverage, which means working smarter, so performance isn’t only about more labour, or working harder.
Developing great Performance Measures doesn’t have to be the challenge that many people experience. PuMP is all about choosing, creating and using the best Performance Measures to execute and achieve strategy. It does this because of its uniquely detailed and practical techniques, and the way it guides people to use these techniques in a very engaging and collaborative way.
Webcast Replay
Watch the webcast replay for Four Ways Leaders Can Measure & Monitor Progress here.